

Truckers should take note of the spot rate rise seen this May. This has been a result of increases in shipper demands. There are some important statistics of interest to be aware of that have resulted from rises in spot rates.
The increase that has been seen in the flatbed load-to-truck ratio specifically is a 3 percent increase that has led to a rate of 111 loads per truck. The new rate of 111 loads per truck is a tie for the record flatbed loads per truck statistic that was seen early in the month of April of this year.
Source: DAT
DAT Network of Load Boards
When it comes to the number of loads regarding the spot market that was seen on the DAT network, there has been a 1.3 percent increase. On the other hand, truck posts have noticed a drop of 1 percent. This is also a result of the increases seen in shipper demand.
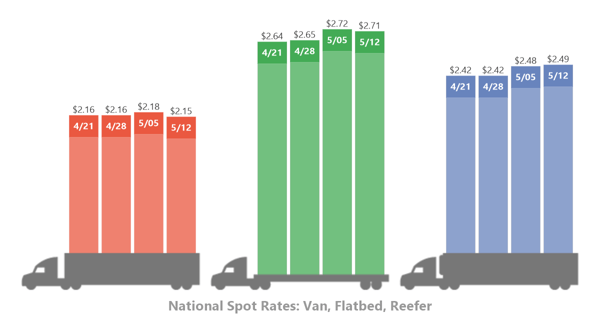
Because of the changes, national average rates for vans, flatbeds, and reefers have adjusted. The rates for vans have gone up 2 cents for a new statistic of $2.18 per mile. For flatbeds, there has been a rise of 7 cents resulting in a statistic of $2.72 per mile. For reefers, there has been an increase of 6 cents for $2.48 per mile.
Spot Market Rates in the Month of April
The rise in shipper demands has been concurrent with changes in spot market rates. The availability of spot truckload freight went up in April compared to March by a rate of 3.9 percent. In April, the available capacity also increased by a rate of 2.2 percent. In terms of year over year rates, the spot truckload freight availability was 100 percent higher and the available capacity rating was 7.5 percent higher.
Van Load Rates
The load posts for vans went up by a total of 1 percent over the past week. On the other hand, van posts themselves went up by 3 percent. This has led to an increase in the ratio regarding load-to truck comparisons of 1 percent, resulting in a statistic of 6.2 loads per truck.
Flatbed Load Rates
While the total sum of load posts for flatbeds has been unchanged nationally, truck posts went down by a total of 3 percent. An increase was seen in the ratio for flatbed loads per truck comparisons of 3 percent, resulting in a statistic of 111 loads per truck. It's worth noting that the ratio for the flatbed load-to-truck comparison has been more than 100 loads for every truck for a sum total that exceeds six weeks now.
Reefer Load Rates
The total sum of reefer load posts has gone up by a total of 10 percent. At the same time, there was an overall decline in truck posts of 2 percent. These changes have made it so that the national reefer load-to-truck ratio statistic increased 12 percent, resulting in a total figure of 9.2 loads per truck. Some of the major markets when it comes to reefers to notice some significant improvements in average outbound rates are the Los Angeles, Lakeland Fl, and Miami markets.
It remains to be seen whether spot rates will continue to rise into June. Keeping an eye on shipper demand will be important in the coming weeks.
